
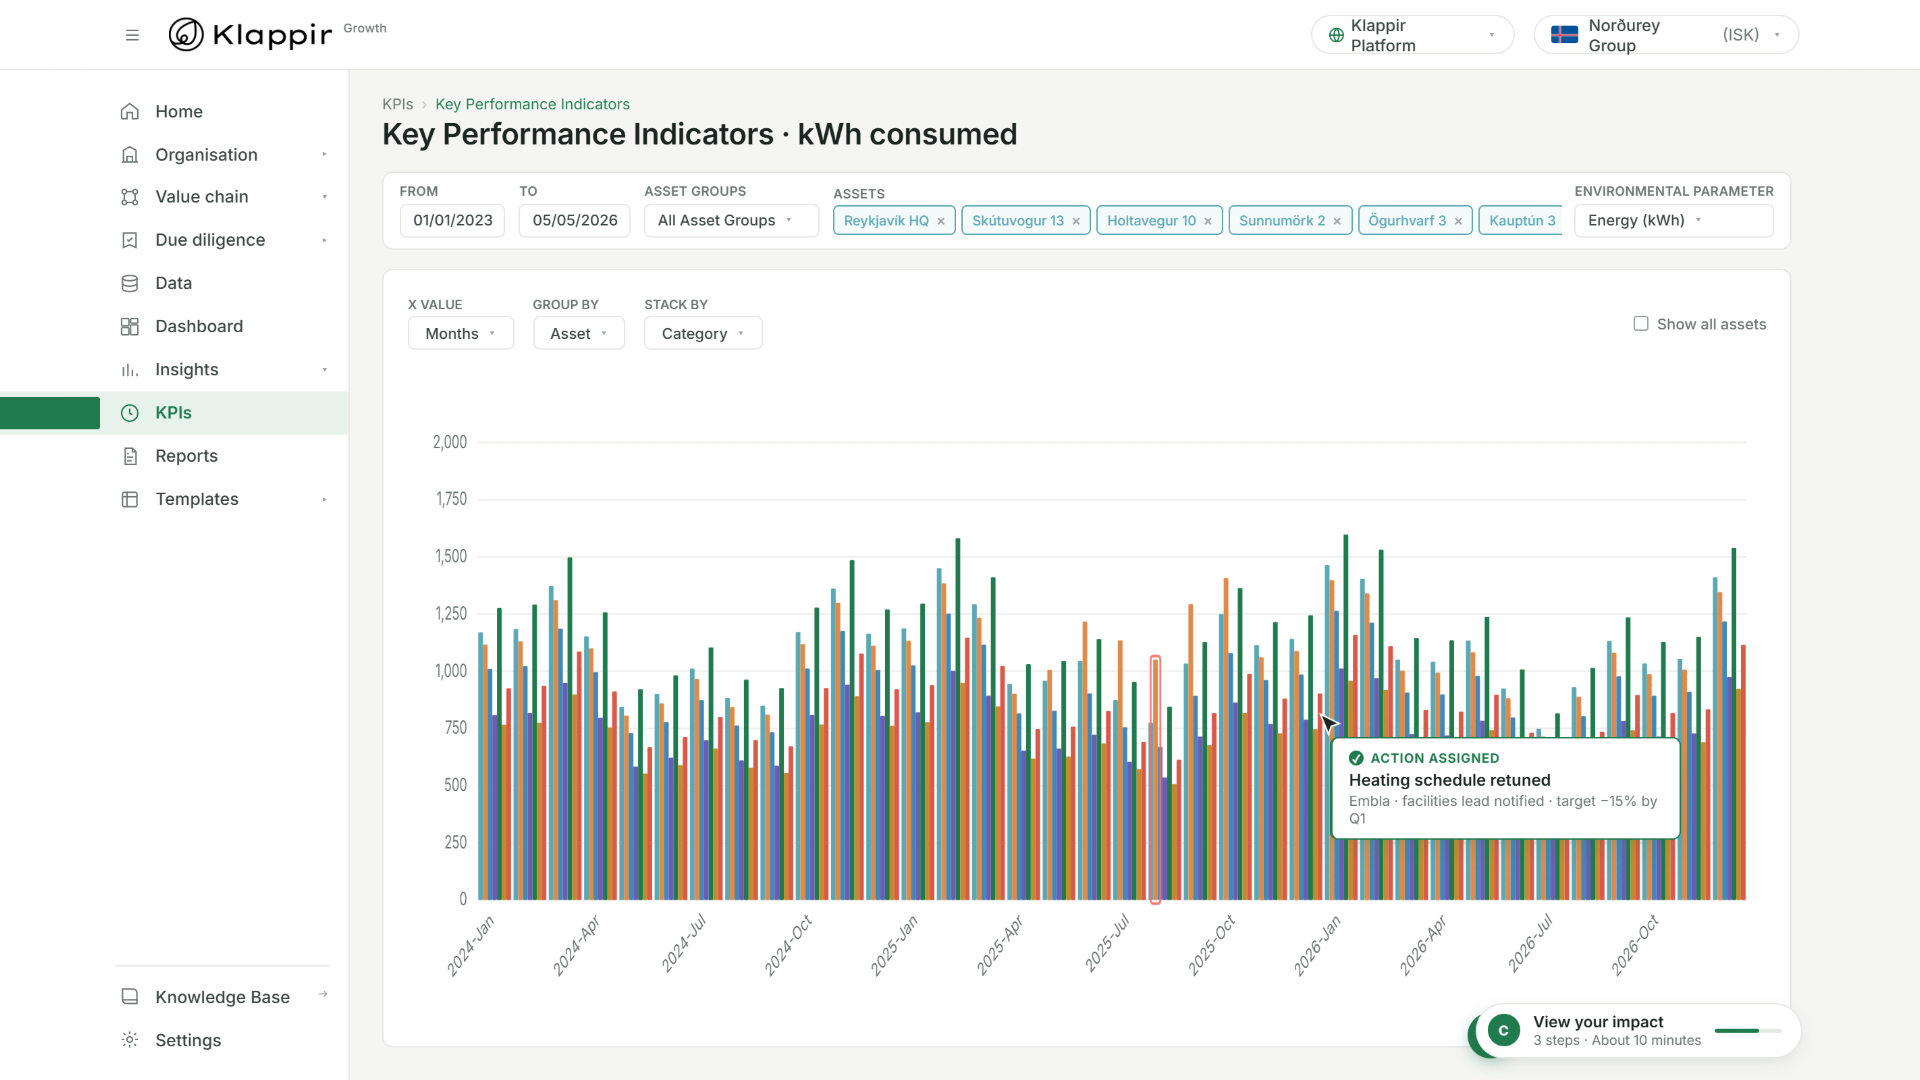




Compare buildings per square metre
Measure use and emissions per m² and benchmark buildings against each other. M. Goldschmidt Ejendomme tests what works in one building before rolling it out.
KPIs →Add guest nights, floor area or output to your resource data, and Klappir compares your sites fairly, so you see where to act.



A busy season uses more water and energy, and that is not a decline. An annual total mixes performance with occupancy, floor area and production, so it cannot show which site to work on. By the time the total arrives, the year is over.
Measure use and emissions per m² and benchmark buildings against each other. M. Goldschmidt Ejendomme tests what works in one building before rolling it out.
KPIs →Divide energy, water and emissions by guest nights to separate performance from occupancy. Grupo Arpoador follows these figures throughout the year.
KPIs →Add a building or asset when it goes into use and compare it with similar ones from the start. Reykjanesbær does this across its assets.
Assets →Resource data is tagged by site and asset and combined with business units such as guest nights, floor area or output. Every figure stays traceable to its source.
Resource data is collected once and tied to each site and asset. Business units such as guest nights or floor area are added alongside it.
Partners and customers who ask for per-unit figures, such as CO₂ per guest night, receive them in the format they need.
Where are we losing money? See which sites use the most per unit, and whether a change in one site has the effect you expected.

“Klappir helped us bring our sustainability data into one place and turn our carbon management into a more reliable, structured and strategic process... This gave us the confidence to report our progress, support our carbon neutral journey and show that sustainable hospitality can be managed with real data.”
Any unit you track: guest nights, floor area, output, employees or revenue. You add the unit alongside your resource data and the KPI tool divides use and emissions by it for each site.
Because a total mixes performance with occupancy, floor area and output. A per-unit figure separates the two, so when it moves, it is worth looking at.
Yes. Add it when it goes into use and compare it from the start. Reykjanesbær monitors new assets as soon as they are in use and compares them with similar ones.
Yes. Per-unit figures can be shared in the format partners need. Guldsmeden Hotels has CO₂ per guest night ready, a figure its business partners increasingly request.
The Core plan is free, with one free data connection included. Core gives you the platform and lets you share and receive data. Your suppliers and customers join Core for free too.
More than 4,500 organisations are in the ecosystem, built around 700+ customers in 26 countries. Core is free to join on both sides of the value chain, includes one free data connection, and is what you need to share and receive data.