




See where energy costs rise
Follow electricity, heat and water use and cost per site and meter, from the data your utilities already hold. Arena Hotels & Suites optimised resource use across three hotels.
Electricity monitoring →Import your electricity, heat and water data, and Klappir organises it by site and meter, so you see where consumption and cost rise.


Your utilities measure what every site uses, month by month, and much of it reaches you as invoices and portal logins. Each site is checked on its own, so a building or a machine that uses more than it should can run for a year before anyone notices. The cost shows up in the total, not where it started.
Follow electricity, heat and water use and cost per site and meter, from the data your utilities already hold. Arena Hotels & Suites optimised resource use across three hotels.
Electricity monitoring →See the energy intensity of each line, machine or building and test what changes it. Ölgerðin cut the oil used for its steam boilers.
Heat monitoring →The same records feed your climate accounts, customer requests and certifications. Scope 2 is covered location-based and market-based.
Carbon accounting →Every reading is classified to international standards and traceable to its source: the meter, the utility or the invoice it came from. When your utility is connected, the data arrives without anyone chasing it.
Energy, heat and water data is collected once, from your utilities, meters and invoices. Every reading is classified the same way and tied to a site, building or asset.
When your utility is in the ecosystem, it shares meter data with you directly. You share the results with a parent company, customers or a bank, in the format they need.
Where are we losing money? See which sites and assets use the most per unit, how that changes month by month, and where to act first.
“The system is a godsend not only for us who do the environmental reporting but also for our machinists and engineers: who now have a comprehensive overview of the energy intensity of every single machine. This is a very practical tool, and it helps us manage resources in smart, sensible ways.”
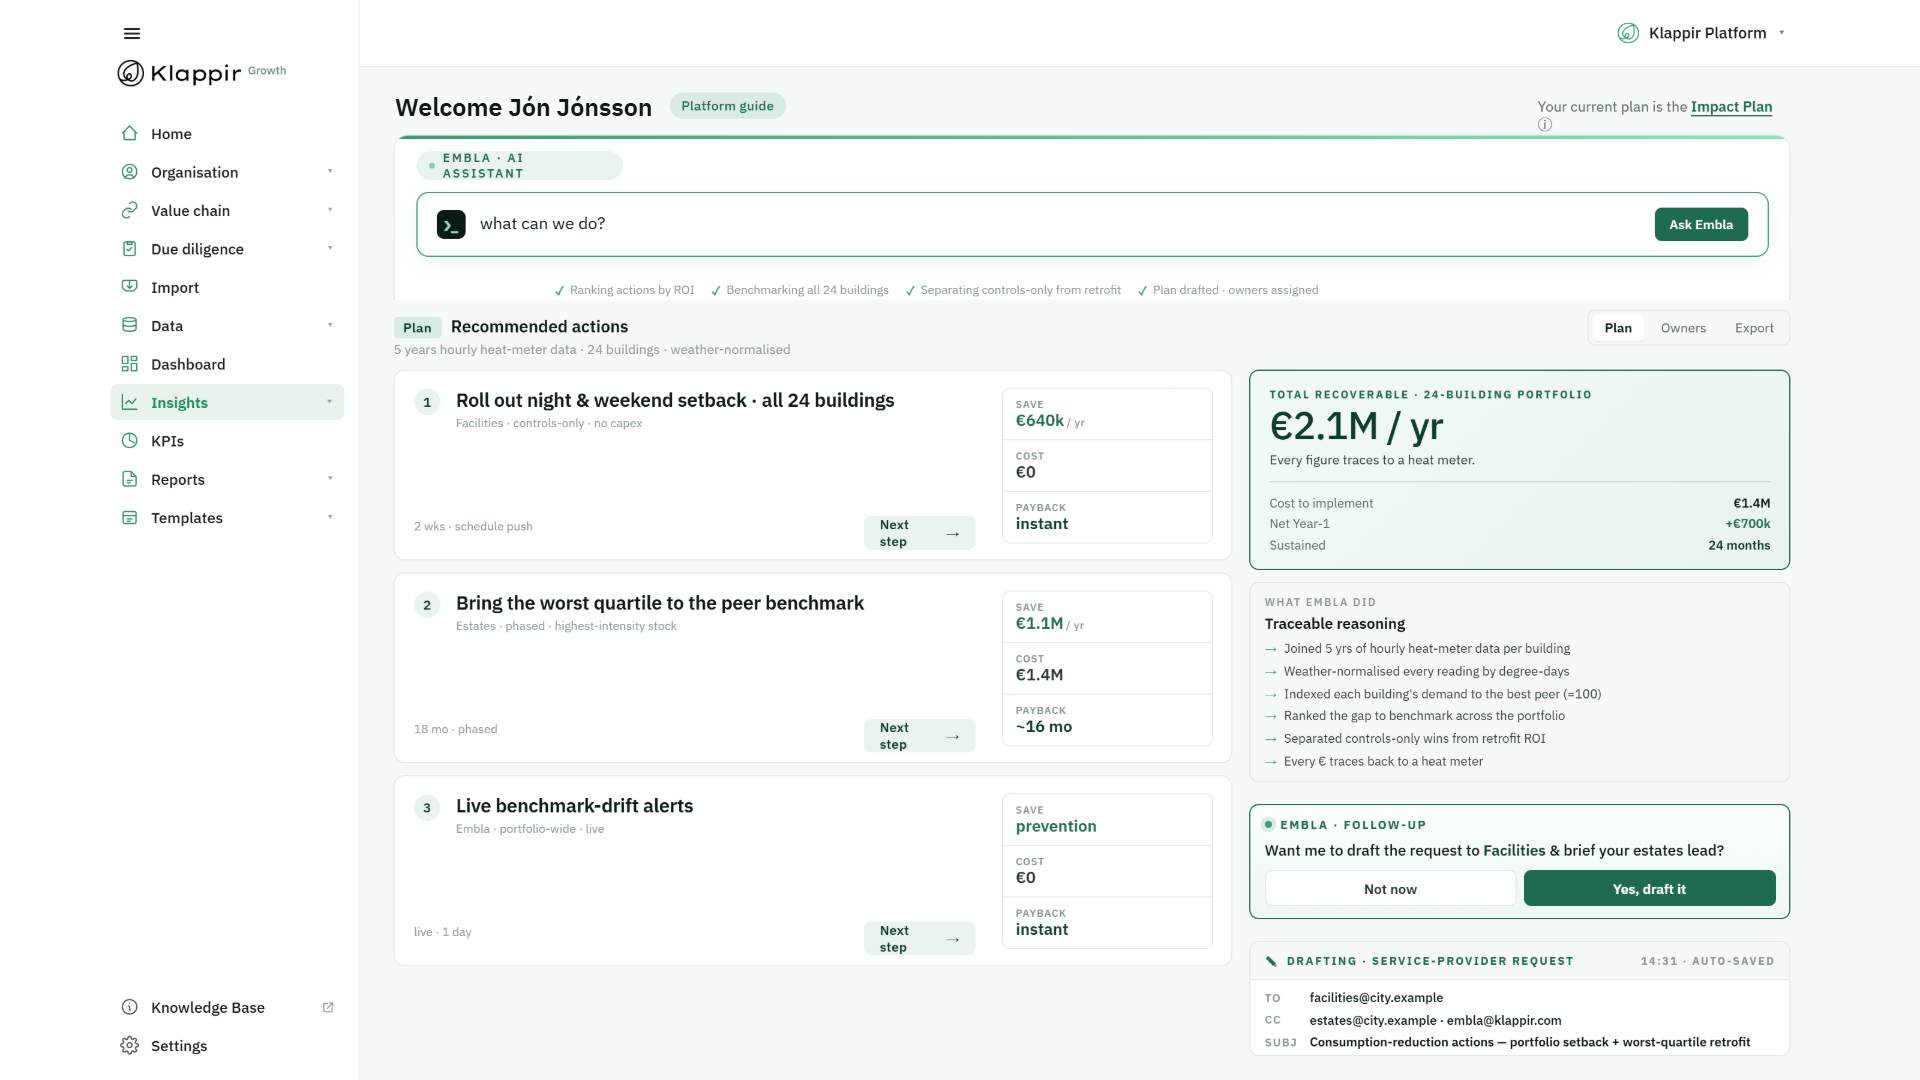
Embla analyses your energy and heating data and points to measurable cost savings, such as sites where use rises outside operating hours. Embla suggests. You decide. Klappir Lab is in early access.
From your utilities, your meters, your invoices and your own files. When a utility is connected as a data partner, meter data arrives by site without anyone chasing it. Other data can come in as uploads, scheduled files over SFTP or through the API, and every route lands in the same structure.
Yes. Data is tagged by site, building and asset. Where you have sub-meters or production data, you can follow energy intensity per line or machine, as Ölgerðin does for its production.
Yes. Electricity, heating and water sit side by side for every site. You can compare them over the same period and see how each one moves with occupancy, production or season.
Emissions are calculated from the same records, built on the foundations of the GHG Protocol. Scope 2 is covered location-based and market-based, and every result links back to the reading and the factor applied. The same data supports CSRD and ESRS disclosures and certifications.
The Core plan is free, with one free data connection included. Core gives you the platform and lets you share and receive data. Your suppliers and customers join Core for free too.
More than 4,500 organisations are in the ecosystem, built around 700+ customers in 26 countries. Core is free to join on both sides of the value chain, includes one free data connection, and is what you need to share and receive data.