
Session 2 recap: What is the data actually telling you?
Your profit and loss statement is already a map of your emissions footprint, if you know how to read it. In Session 2 of Finance Meets Sustainability, Line Knudsen from Keepers and Pavlina Caccioni from Konges Sløjd walked through how financial data drives emissions accounting, supplier dialogue, and the reality check on whether your sustainability initiatives are actually working. The recording is ready. Fill in your details below, and we'll reveal the link to you.
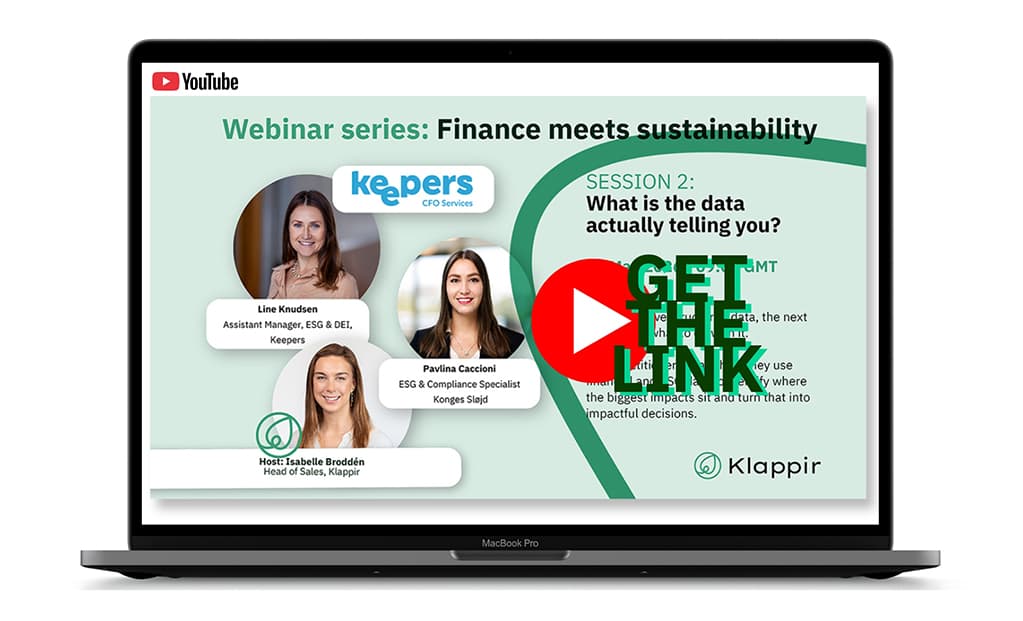
If you missed the session or want to revisit it, you're welcome to the full recording. Fill in the form below, and we'll send it to you directly.
Session 2 of Finance Meets Sustainability, held on 27 May, focused on making active use of financial data in sustainability work. Line Knudsen, Assistant Manager in Keepers' ESG team, walked through how a profit and loss statement maps directly to an emissions account. Pavlina Caccioni, ESG and Compliance Specialist at Konges Sløjd, brought experience from the hospitality sector on supplier dialogue, prioritisation, and testing whether initiatives hold up when you check the financial data alongside the operational results.
Your P&L is already a map
The profit and loss statement shows your patterns of expenditure, your investments, and your biggest suppliers. It is a complete record of what an organisation spends money on, which means it also reflects every activity with an emissions profile. If you apply a financial control consolidation approach to your emissions accounting, everything inside your financial control is already accounted for, and you get alignment between your financial statement and your sustainability statement.
The mapping from P&L to emissions account follows the GHG Protocol scopes: travel expenses into Scope 3.6, purchased goods and services into Scope 3.1, electricity into Scope 2. "It is a very good place to start," Line said.
Granularity is where it gets precise. "Purchased goods and services" covers a lot of ground, and the emissions factors for IT equipment and food and beverages are not remotely similar. The more you can open up a category and see what is inside it, the more the number reflects reality. "The more detail you have, the better the result," Line said. "We always try to obtain the highest level of granularity possible."
In practice, Keepers uses DEFRA, the UK government's emission factor database, to assign a factor to each sub-category once it has been identified. The distinction matters: a spend-based approach applied to a broad "IT equipment" line will produce a different number depending on whether the category turns out to be screens, telephones, or servers.
Spend-based data is a diagnostic, not a destination
Spend-based data is easy to access, you can usually pull the P&L statement from the finance department and have a foundation for your emissions account. The trade-off is that the emission factors are broad, and in some categories the difference from activity-based calculation is material.
Line shared a case from a private equity firm with 60 portfolio companies. For business travel, the team calculated flight distances between city pairs rather than applying an emission factor to what each trip cost. Nordic air travel is expensive, and multiplying a high ticket price by an emission factor per unit of spend inflates the footprint in a way that does not correspond to actual emissions. Activity-based produced a substantially lower number, and a more accurate one.
"You can use it to identify hot-spots and key reduction potential," Line said of spend-based data. "But I would always recommend going activity-based where possible, because it is more precise." The practical approach is to use spend-based data to identify which categories are worth the deeper work, then go activity-based in those areas where it is possible.
Supplier dialogue is part of the process
Pavlina, who built the sustainability function at Kurhotel Skodsborg before moving to Konges Sløjd, works in the part of Scope 3 where data quality depends directly on supplier relationships.
Some suppliers can provide full activity data. Some are working towards it. Particularly with smaller or local suppliers, the process takes time. "It is about collaboration," Pavlina said. "Especially with smaller or local suppliers, you have to approach it as working on this together, not demanding data they do not yet have."
The category shape matters too. A single-category supplier is relatively straightforward. A general office supplies account covering cleaning products, stationery, and paper under one invoice is not. Emissions factors across those sub-items vary enough that a spend-based approach is often the only practical option until the supplier relationship matures.
Double materiality as a prioritisation tool
Pavlina has worked with CSRD reporting and the double materiality assessment, and her experience is that it is more useful than its reputation as a compliance exercise suggests. For small sustainability teams deciding where to focus their time, it is one of the better prioritisation tools available.
When financial risk is layered in alongside sustainability impact and visualised as a colour-coded overview, the result travels through an organisation in a way that a sustainability-only narrative does not. "When you actually need to ask for a budget to implement something, the double materiality assessment gives you quite a great overview that many people can easily understand," she said.
When the data says the initiative is not working
Pavlina's examples from the hospitality sector made a practical point about evaluating sustainability initiatives: you have to connect the sustainability data with the financial data, and also account for the effect on customer experience.
A two-degree reduction in water temperature can show up as measurable improvement in energy figures. But it can also generated customer complaints about cold water. A separate experiment, staggering the start-up of high-temperature equipment like saunas to reduce peak demand, produced no measurable difference at all. "You would think the small changes might make big differences," Pavlina said. "But you look at your financials after, and you see it does not actually make so much difference."
In the service industry in particular, financial and sustainability data need to be read alongside operational results, not just against each other.
All three recordings in one place, plus the e-book. Fill in the form below to get access. 👇
Klappir
Klappir Green Solutions
Klappir is a sustainability data platform that helps organizations measure, manage, and report their environmental impact.